
Domain 3 is 35% of the PMI-SP exam: the six official tasks from status collection to baseline control, DCMA checks, EVM formulas and a shipbuilding self-test.
Domain 2 ends with an approved baseline. Domain 3 covers what happens to it once work starts: collecting status, reading the numbers honestly, testing recovery options and changing the plan only through change control. This lesson covers the six official tasks, the metrics and formulas the exam expects, common traps and a short self-test built on a shipbuilding example.
Domain overview
The PMI-SP Examination Content Outline describes Domain 3 as "activities related to monitoring the project schedule progress, performing schedule analyses, and managing change appropriately." At 35% it is the heaviest of the five domains, ahead of Domain 2 at 31%.
The PMI-SP Handbook gives 170 multiple-choice questions, 150 scored and 20 unscored pretest items, in three and a half hours. At 35%, Domain 3 is roughly 52 to 53 scored questions. The content outline PMI publishes for this credential is dated 2012, so check the PMI-SP page for a newer version before you book.
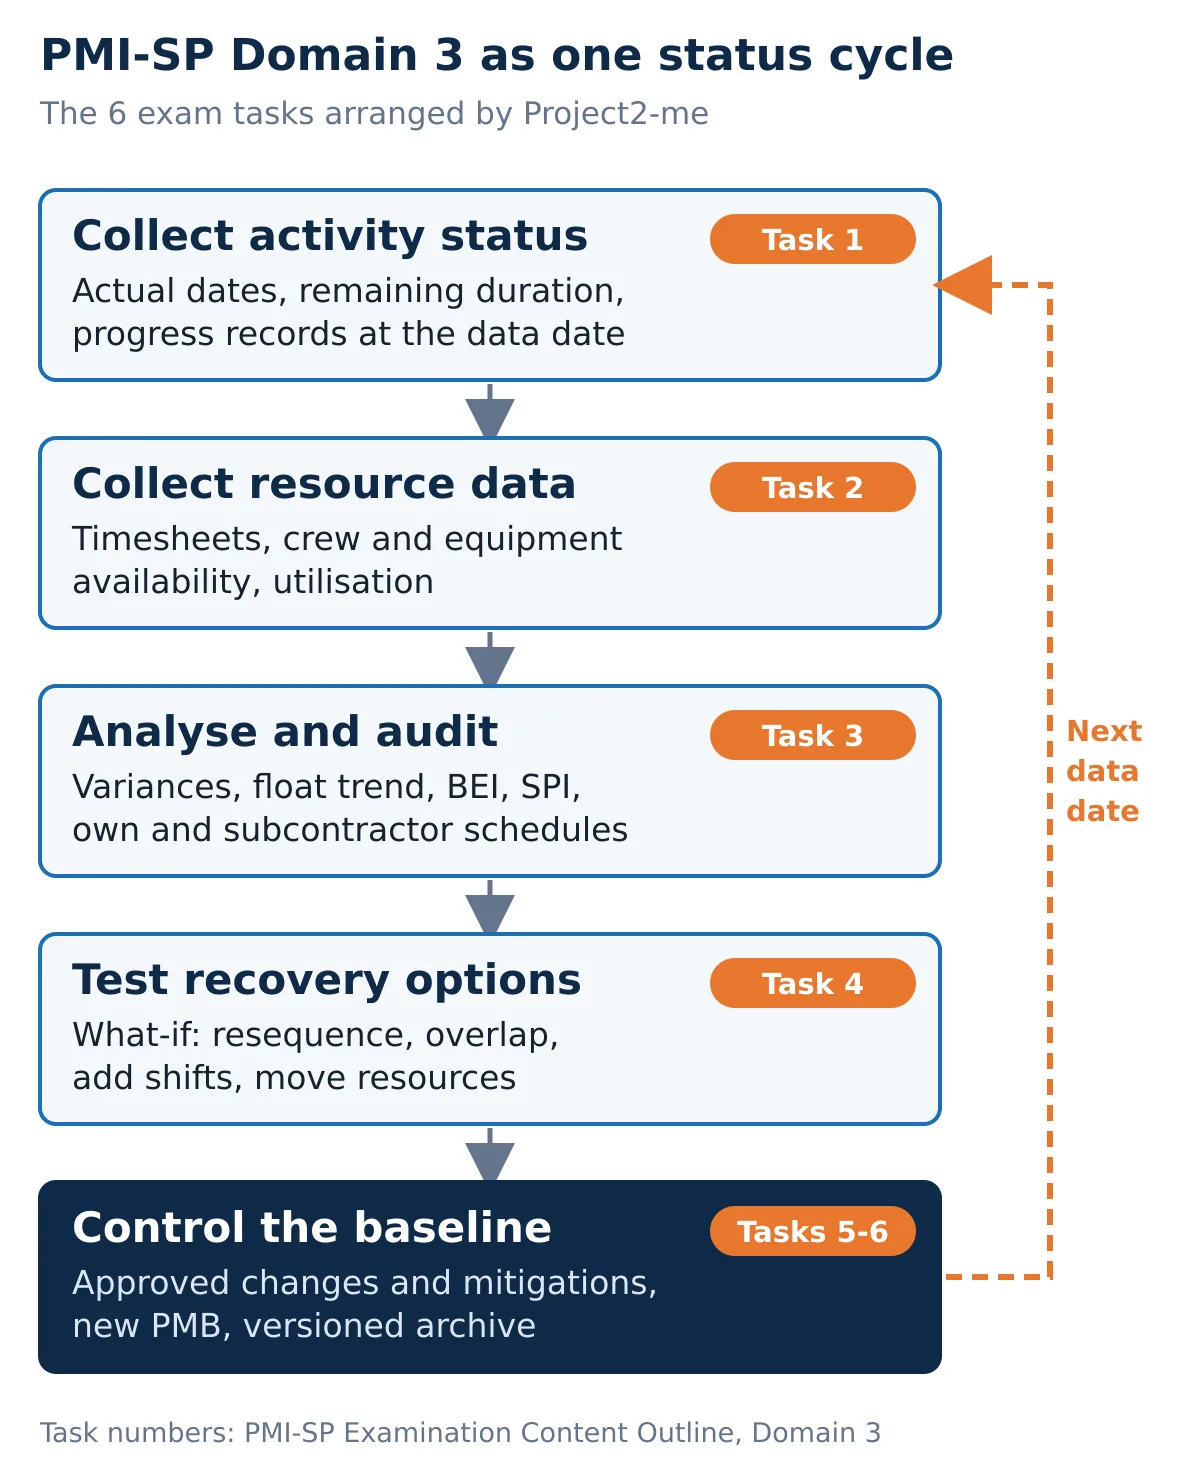
The outline lists six tasks. In practice they repeat every reporting period, so the figure arranges them as one cycle. The arrangement is ours, the task numbers are PMI's.
Building the model and the baseline belongs to Domain 2: Schedule Planning and Development. Final acceptance, lessons learned and archiving the as-built schedule belong to Domain 4: Schedule Closeout, and most of the reporting relationship with stakeholders sits in Domain 5. The PMI-SP exam content overview maps all five.
Task 1: Collect activity status
In the outline: collect activity status at defined intervals from activity owners, through reports, meetings, inspections or other standard procedures, to update and review project progress.
Every update is anchored to a data date, which the PMI Lexicon defines as the point in time when project status is recorded. The GAO Schedule Assessment Guide states the rule plainly: dates before the status date are history, dates after it are forecasts. No actual date may sit in the future and no unfinished work may sit in the past. The DCMA 14-point assessment turns this into Check 9, which fails any schedule with invalid forecast or actual dates.
The outline gives three examples of progress measurement: percent complete, actual and remaining duration, and estimate to complete. GAO prefers the second. A foreman who has spent 7 days on a 10-day activity tends to report "70 percent", which measures elapsed time, not work done; asking for remaining duration gives a better forecast. GAO allows percent complete for level-of-effort activities, which the Lexicon defines as support work measured by the passage of time rather than by a product.
GAO also expects progress records, often a turnaround sheet the activity owner fills in with actual start, actual finish, actual duration or work, and remaining duration. On a newbuild the physical evidence is usually close at hand. Illustrative example: block B12 is "started" when the first plates are laid on the panel line, and "finished" when the dimensional check is signed, not when the welders move on. GAO recommends agreeing such definitions in advance.
Out-of-sequence progress is a favourite exam topic. When outfitting starts on a block before its predecessor is complete, the scheduler chooses between retained logic, where the remaining work waits for the predecessor, and progress override, where the work continues and the predecessor logic is ignored. GAO notes the two settings can produce very different forecast dates, and after an override the original link should be reviewed and repaired.
Task 2: Collect resource information
In the outline: collect resource information and updates via reports, timesheets, meetings, inspections or other standard procedures, to report on resource utilization and availability.
Dates alone do not explain a slip. Task 2 asks what the resources actually did: hours booked, crews present versus planned, equipment out of service. The related knowledge areas in the outline are the resource breakdown structure, resource calendars, resource groups and resource allocation techniques.
In a shipyard the resources that drive dates are often shared: the gantry crane, the dock, the blasting hall and certain trades such as pipe fitters. Illustrative example: timesheets show the hull welding crew on your block at 60% of plan for three weeks because the same crew was pulled to a sister hull. The schedule shows the delay, but only the resource data shows the cause, and the cause decides the fix. See resource leveling and crane and dock capacity and estimating man-hours.
Task 3: Schedule analysis and audit
In the outline: perform schedule analysis and audit on in-house and subcontractor schedules, using industry standards, guidelines and best practices, to identify and report schedule status, changes, impacts or issues.
This task has three parts: check the model, measure performance, explain the trend.
Auditing the model. Two common references are the GAO guide's ten best practices and the DCMA 14-point assessment. DCMA checks that matter during execution:
- Check 9, invalid dates: actual dates after the data date, or forecasts before it.
- Check 11, missed tasks: activities finished later than their baseline finish; the 09NOV09 version sets a 5% pass limit.
- Check 12, critical path test: add a large delay (DCMA uses 600 days) to a critical activity and confirm the finish moves by about the same amount. If it does not, logic is broken.
- Check 13, CPLI: critical path length plus total float, divided by critical path length. The target is 1.0; below 0.95 fails.
- Check 14, BEI: activities actually completed divided by activities that should have finished by the data date. The target is 1.0; below 0.95 fails.
GAO adds that the BEI is a summary measure: a late critical activity counts the same as a late activity with plenty of float. GAO also expects subcontractor schedules to be correctly integrated in the master schedule, so a joinery package cannot be a single date typed in by the yard.
Measuring performance. The core earned value measures, as defined in the PMI Lexicon and the DAU EVM Gold Card:
| Measure | Formula | Reading |
|---|---|---|
| Schedule variance | SV = EV − PV | Negative: less work earned than planned |
| Schedule performance index | SPI = EV / PV | Below 1.0: behind plan |
| Cost variance | CV = EV − AC | Negative: over budget |
| Cost performance index | CPI = EV / AC | Below 1.0: overspending for the work done |
| Estimate at completion | EAC = BAC / CPI, or AC + (BAC − EV) / (CPI × SPI) | Forecast final cost |
| Estimate to complete | ETC = EAC − AC | Cost of the remaining work |
| Variance at completion | VAC = BAC − EAC | Forecast overrun or underrun |
| To-complete performance index | TCPI = (BAC − EV) / (BAC − AC) | Efficiency needed on remaining work to finish at BAC |
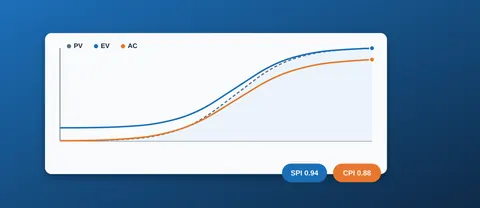
Illustrative example for one hull section (BAC $20.0 million): at the end of month 8, PV = $8.40 million, EV = $7.56 million, AC = $9.10 million.
- SV = −$0.84 million and SPI = 0.90: work worth 90% of the planned value has been earned.
- CV = −$1.54 million and CPI ≈ 0.83.
- EAC = 20.0 / 0.83 ≈ $24.1 million, so VAC ≈ −$4.1 million. The composite formula gives about $25.7 million.
- TCPI ≈ 1.14: to finish at the original budget, the remaining work must run at a CPI of about 1.14, while the section is currently at 0.83.
Two limits matter. First, SPI is measured in money, not time, and ignores the critical path: a section can show SPI 1.0 while the block that drives erection is late. Second, at completion EV and PV both equal BAC, so SPI ends at 1.0 however late the work finished. Earned schedule, introduced by Walt Lipke in 2003, addresses this by finding the time at which the planned value equalled today's earned value. In the example, if PV was $7.20 million at month 7, ES = 7 + (7.56 − 7.20) / (8.40 − 7.20) = 7.3 months, so SV(t) = −0.7 months and SPI(t) ≈ 0.91.
More in the shipyard EVM lesson, EVM in shipbuilding and the EVM tracker template.
Explaining the trend. GAO recommends plotting measures each period rather than reading one update: completed versus planned activities, forecast versus past completion rates, total float and contingency. GAO warns that a quick draw-down of total float early in a program may signal more serious delays and cost overruns later. Near-critical paths deserve the same attention as the critical path; the CPM lesson for shipbuilding covers float in detail.
Task 4: Identify alternative execution options
In the outline: identify alternative project execution options, using tools and techniques such as what-if scenario analyses, to optimize the schedule.
A what-if analysis runs a copy of the current schedule with a change and compares the result. The standard levers, as defined in the Lexicon:
- Crashing: add resources to shorten duration at the least incremental cost.
- Fast tracking: run activities normally done in sequence in parallel for part of their duration, which adds risk and possible rework.
- Resequencing or re-planning within the same scope, for example changing the block erection order around a late block.
- Resource and calendar changes: second shift, weekend work, a crew from a hull with float.
Illustrative example: pipe spools for an engine room block arrive three weeks late. Option A holds the block for the spools. Option B erects on time and fits the spools on board, costing more hours in a tighter space. Option C swaps erection order with the neighbouring block, if the structure allows. The scheduler models each option, shows the effect on finish date, critical path and resource load, and management chooses. Nothing changes in the baseline yet.
Task 5: Incorporate approved risk mitigation
In the outline: incorporate approved risk mitigation activities into the schedule, using defined change control processes, to establish a new performance measurement baseline (PMB).
The Lexicon defines the PMB as the integrated scope, schedule and cost baselines used to measure performance. An approved mitigation, such as a temporary second crane, is new work with its own time and cost. It enters the baseline through change control, not as a quiet edit, so earned value keeps measuring against an honest plan.
The outline also lists cost and schedule reserve analysis. The Lexicon distinguishes contingency reserve, time or money inside the baseline for known risks with active responses, from management reserve, held outside the baseline for unforeseen work within scope. In monitoring, the question each period is how fast contingency is being consumed compared with the risk that remains. The shipyard risk management article and the risk register template show the register side.
Task 6: Update the model and document baseline changes
In the outline: update the schedule model and document schedule baseline changes received through formal change control processes, to maintain an accurate schedule and facilitate forensic schedule analysis, if required.
The Lexicon defines change control as the process by which changes to documents, deliverables or baselines are identified, documented, approved or rejected, and a change control board as the group that decides. The schedule baseline is the approved schedule model, changed only through that process. GAO draws a useful line between statusing, recording actual facts, and revising, changing the plan for remaining work.
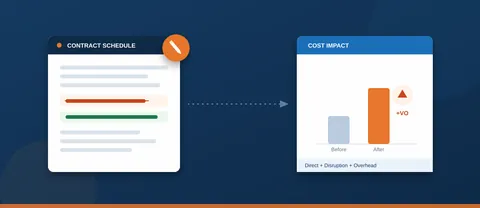
GAO describes rebaselining as a way to restore meaningful performance measurement when the remaining baseline is no longer realistic. It warns that a rebaseline normally wipes out historical variances, and that frequent rebaselining suggests poorly understood scope or weak discipline. On a newbuild, an approved owner change that adds scope is a baseline change; a yard slipping on its own work is not. See change and variation orders in ship newbuilding and the variation order form.
For the forensic side, GAO recommends that each approved update is given a version number and archived, and that a schedule narrative accompanies it: status of key milestones, reasons for changed dates, changes to logic, lags and constraints, and a comparison of the critical and near-critical paths with the previous period. GAO also advises against deleting activities from a baselined schedule; zero the remaining duration and note why instead. That record is what a delay analyst needs if a dispute follows. AACE International's Recommended Practice 29R-03, Forensic Schedule Analysis, describes the methods such an analyst uses. See also how a shipbuilding contract handles delays.
Typical exam traps
- Statusing vs revising: actual facts versus a changed plan for future work.
- Data date: actual dates never after it, forecasts never before it.
- Percent complete: elapsed time is not progress; remaining duration is the better question.
- SPI vs critical path: a good SPI does not mean the critical path is on time.
- SPI at completion: always 1.0; SPI(t) from earned schedule is not.
- Contingency vs management reserve: inside versus outside the baseline.
- Change vs rebaseline: approved scope changes update the baseline; rebaselining resets variance and should be rare.
- Corrective vs preventive action: the Lexicon defines corrective action as realigning performance with the plan, and preventive action as keeping future performance aligned.
Test yourself
These questions are written for this lesson, not taken from any PMI question bank.
1. The data date is 30 June. A block shows an actual finish of 2 July. Which DCMA check fails? A) Missed tasks. B) Invalid dates. C) BEI. D) Critical path test.
2. A foreman reports "70% complete" on a 10-day activity after 7 working days. What should the scheduler ask for? A) Nothing, 70% is correct. B) Actual start and remaining duration. C) The planned finish. D) The foreman's hours only.
3. PV = 5.0, EV = 4.5, AC = 5.0 and BAC = 20 (millions). What is EAC using BAC / CPI? A) 20.0. B) 21.1. C) 22.2. D) 25.0.
4. SPI is 1.02 but the block that drives erection is two weeks late. Best reading? A) The project is ahead. B) SPI is wrong. C) Non-critical work is ahead while the critical path is behind; analyse the driving path. D) Rebaseline.
5. Management approves hiring a second crane for eight weeks to protect a late erection sequence. Which Domain 3 task covers putting it into the schedule? A) Task 1. B) Task 3. C) Task 4. D) Task 5.
6. At a status date, 88 activities have finished out of 100 planned to finish by then. What is the BEI and the DCMA result? A) 0.88, fail. B) 0.88, pass. C) 1.14, pass. D) 0.12, fail.
Answers: 1 B, an actual date after the data date. 2 B, as the GAO guide recommends. 3 C, CPI = 0.9 and 20 / 0.9 ≈ 22.2. 4 C, SPI is a money measure across all work. 5 D, approved mitigation through change control into a new PMB. 6 A, below the 0.95 threshold.
Where this leads
Domain 3 runs until the last activity is statused. What remains is closing the schedule: final acceptance, final performance evaluation, lessons learned and archiving, covered in Domain 4. For the MS Project side of baselines and progress, see getting started with MS Project for shipbuilding schedules. Study this domain alongside the PMI-SP Examination Content Outline and PMI's Practice Standard for Scheduling, third edition.