About this template
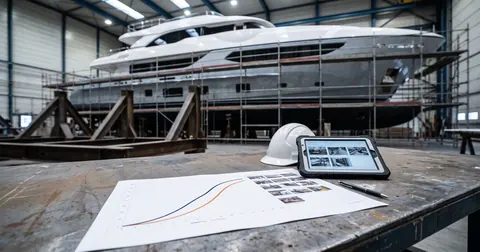
Excel workbook that turns activity weights and percentages complete into one physical progress figure on a 0 to 100 scale. One line per activity with weight, rule of credit, critical-path flag, planned and measured %, evidence reference; formulas for planned and measured value, variance, index, status against green and red thresholds and a count of critical lines behind plan. A monthly log draws the S-curve and the progress index. Blank sheet plus an Example sheet with the month-14 measurement of the fictional yacht YP-48 (illustrative figures).