

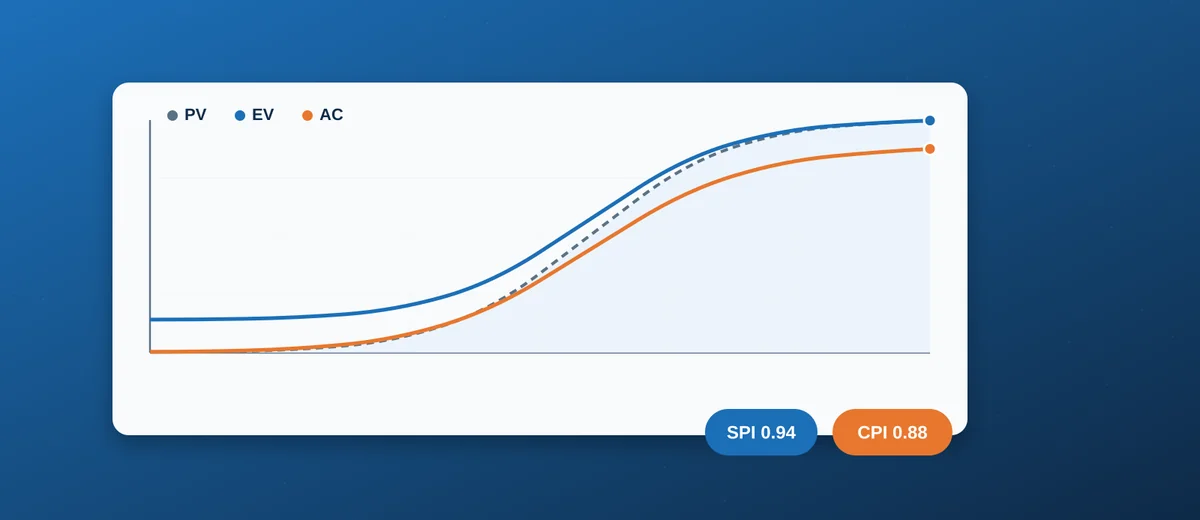
How Earned Value Management turns a shipbuilding schedule and budget into one honest number — Planned Value, Earned Value and Actual Cost, the SPI/CPI metrics that expose trouble months before it shows up in a progress meeting, and how to set up EVM against a WBS-based newbuild schedule — with a downloadable EVM Tracker template.
Every shipyard project manager has sat through a progress meeting where the schedule says the vessel is on track, the cost report says the budget is on track, and yet the project is quietly heading for trouble. The reason is usually that schedule and cost are being reported as two disconnected stories. Percent-complete is estimated by feel, actual spend is tracked separately in the finance system, and nobody is asking the one question that actually predicts the outcome: for the money and time spent so far, how much work has genuinely been earned?
Earned Value Management (EVM) answers exactly that question. Originally developed for U.S. defence programmes and now standard practice across EPC, offshore and shipbuilding projects, EVM converts physical progress into a dollar or man-hour figure that can be compared directly against both the budget and the schedule — on the same axis, in the same unit. It does not replace a Gantt schedule or a cost report; it sits on top of both and tells you, objectively, whether the project is really where it claims to be.
1. The Three Numbers EVM Is Built On
Every EVM calculation reduces to three inputs, tracked at whatever level of the WBS you choose to control:
- Planned Value (PV) — the budgeted cost of the work that was scheduled to be done by this point in time. This comes straight from the time-phased baseline budget, not from anything that happened on the shop floor.
- Earned Value (EV) — the budgeted cost of the work actually completed by this point, regardless of what it cost to do it. EV is the physical-progress number, expressed in budget dollars.
- Actual Cost (AC) — what was genuinely spent (labour, material, subcontract) to produce that EV. This comes from the cost/finance system, not the schedule.
The reason EVM is more honest than a simple percent-complete report is that PV, EV and AC are collected independently, from three different sources — the baseline schedule, physical progress measurement, and the accounting system — and only compared with each other afterwards. There is no single person who can quietly make the project look healthy by adjusting one number, because the other two will immediately expose the gap.
1.1 Why Percent-Complete Alone Is Misleading
A block reported as “70% complete” by a foreman is a subjective estimate, usually optimistic, and it says nothing about cost. A project can be 70% complete on schedule while having already consumed 85% of its budget — a fact that a simple progress percentage will never surface, but that EV versus AC exposes immediately. This is the single biggest reason yards that migrate from percent-complete reporting to EVM discover cost problems 2–3 months earlier than before.
2. The Key EVM Metrics
2.1 Schedule Variance (SV) and Schedule Performance Index (SPI)
SV = EV − PV and SPI = EV / PV. A negative SV or an SPI below 1.0 means less work has been earned than was planned by this date — the project is behind schedule in value terms, independent of what any single Gantt bar shows. SPI is particularly useful at program level, where dozens of Gantt bars can be individually late or early and cancel each other out visually, but the aggregate SPI cannot hide.
2.2 Cost Variance (CV) and Cost Performance Index (CPI)
CV = EV − AC and CPI = EV / AC. A CPI below 1.0 means the work completed cost more than its budgeted value — the project is over budget for what has actually been earned, regardless of how much cash remains unspent in the overall budget line. CPI is the earliest reliable warning of a block, outfitting package or subcontract that is bleeding margin.
2.3 Estimate at Completion (EAC) and To-Complete Performance Index (TCPI)
The metric owners and yard management care about most is the honest forecast: EAC (Estimate at Completion), most commonly calculated as EAC = AC + (BAC − EV) / CPI, where BAC is the total Budget at Completion. This formula assumes the cost-performance trend observed so far will continue for the remaining work — a far more defensible forecast than “we’ll make it up later,” which is the default (and usually wrong) assumption behind a manually re-forecast budget. TCPI then answers the follow-up question: what cost-efficiency must the remaining work now achieve to still finish on the original budget? When TCPI climbs meaningfully above the CPI achieved so far, it is a mathematical signal that recovery on the current budget is unrealistic without a scope, schedule or resourcing change.
3. Setting Up EVM for a Newbuild Project
3.1 The Performance Measurement Baseline (PMB)
EVM is only as good as the baseline it is measured against. The Performance Measurement Baseline is the time-phased budget for the full, authorised scope — every control account’s cost, spread across the schedule using the same logic as the master schedule’s task dates. Building the PMB properly means the WBS, the cost breakdown structure and the master schedule must already agree with each other; a newbuild project that has not aligned its Cost Breakdown Structure with its WBS and schedule cannot run credible EVM, because PV cannot be time-phased consistently.
3.2 Control Accounts Aligned to the WBS
EVM is normally run at the control account level — a manageable intersection of WBS element and responsible department, typically 20–80 control accounts for a single vessel (hull steel by block/zone, outfitting by system, major equipment packages, engineering, project management). Too coarse a breakdown hides problems inside a large bucket; too fine a breakdown creates a reporting burden nobody sustains past the first two progress cycles. Most yards find the natural level sits close to the same block/zone/system groupings already used for the construction schedule and material take-offs, so no separate structure needs to be invented.
3.3 Measuring Physical Progress
EV depends on an objective progress-measurement method for each control account, agreed before work starts — not decided retroactively when a report is due. Three methods cover most shipbuilding work:
- Milestone / weighted-steps — a fixed set of milestones per activity (e.g. cut, fit, weld, NDT, paint) each carrying a pre-agreed percentage weight; progress jumps only when a milestone is formally signed off. Best for steelwork and structural outfitting.
- Units-complete — EV accrues in direct proportion to physical units finished against a known total (metres of pipe welded, cables pulled, joints tested). Best for repetitive, highly quantifiable scopes like piping, cabling and painting.
- Level of effort (LOE) — used only for genuinely time-based support work (project management, QA oversight) where EV is simply earned in step with elapsed time, since there is no discrete deliverable to measure.
Mixing these deliberately by scope type — rather than applying one method to the whole project — is standard practice and keeps the progress numbers defensible when an owner’s representative or class surveyor asks how a percentage was derived.
4. EVM on the Shipyard Floor
4.1 Block Construction and Steelwork
Hull steel is the easiest scope to run EVM against, because tonnage and man-hour budgets per block are usually already estimated with reasonable accuracy, and the milestone-weighted method maps cleanly onto the fabrication sequence — the same sequence used to build the erection schedule (see Hull Block Construction Sequencing and Critical Path Management). A block running CPI below 1.0 in the panel shop is a strong early predictor of erection-stage schedule pressure, months before the block reaches the building berth.
4.2 Outfitting and Systems Integration
Outfitting is where EVM earns its keep, because outfitting progress is notoriously hard to eyeball — a compartment can look 90% finished visually while the last 10% (commissioning, testing, punch-list closure) consumes a disproportionate share of remaining hours. Units-complete measurement against pipe spools, cable pulls and equipment hook-ups keeps EV honest through exactly the phase where percent-complete-by-eye is at its most unreliable.
4.3 Rolling Up to Program Level
For yards building sister vessels or running several newbuilds concurrently, control-account EV rolls up cleanly to hull level, then to program level, giving management a single SPI/CPI pair for the whole order book. This is where EVM moves from a project-control technique to a portfolio-management tool — and where a consistent WBS/control-account structure across sister vessels pays for itself, since hull two and hull three can be benchmarked directly against hull one’s actual cost-performance curve rather than against the original estimate alone.
5. Common Pitfalls
5.1 Front-Loading the Budget
If early activities are assigned more budget than their real cost share (deliberately or through optimistic early estimating), EV and CPI look artificially healthy in the first third of the project, then collapse later when the true cost of remaining work reasserts itself. This is one of the most common ways EVM gets discredited — not because the technique failed, but because the baseline it was measured against was never realistic.
5.2 The “Bow Wave” Effect
Rework, incomplete punch-list items and deferred outfitting tasks tend to accumulate silently behind the reported progress line, then surface all at once close to sea trials — the classic “bow wave.” EVM only catches this if incomplete work is genuinely excluded from EV rather than credited on an optimistic assumption that it will be finished later at no extra cost. Progress measurement discipline matters more than the sophistication of the formula.
5.3 Treating EVM as a Reporting Exercise, Not a Management Tool
EVM that exists only to populate a monthly slide is a wasted administrative burden. Its value comes from acting on SPI/CPI trends while there is still time to change resourcing, sequencing or scope — not from a chart that confirms, three weeks after the fact, what the site team already suspected.
6. Tools: From Spreadsheets to MS Project
EVM does not require specialist software. A well-structured spreadsheet with live PV/EV/AC/SV/CV/SPI/CPI formulas, colour-coded status, is enough for a single-vessel project or a yard just starting to adopt the discipline — our downloadable EVM / Earned Value Tracker template is built exactly this way, ready to plug control-account budgets and periodic actuals into. For yards already scheduling in Microsoft Project, cost and baseline fields native to MS Project (Baseline Cost, % Complete, Actual Cost) can feed the same PV/EV/AC calculations directly from the schedule file itself, and a schedule shared as read-only through a browser-based MS Project Viewer lets the owner’s team and finance follow the same baseline-versus-actual picture without needing an MS Project licence of their own.
Conclusion
Earned Value Management works because it refuses to let schedule and cost tell separate stories. By measuring physical progress independently and comparing it against both the time-phased baseline and the actual spend, EVM surfaces the gap between “on track” and “actually on track” months before it would otherwise appear in a progress meeting. The mechanics — PV, EV, AC and the ratios built from them — are simple enough to run in a spreadsheet from day one of a newbuild contract; the discipline is in defining control accounts and progress-measurement rules before work starts, and in acting on the numbers once they start moving.